|
Introduction and Screen Shots
The SQuirreL desktop in Ocean Theme
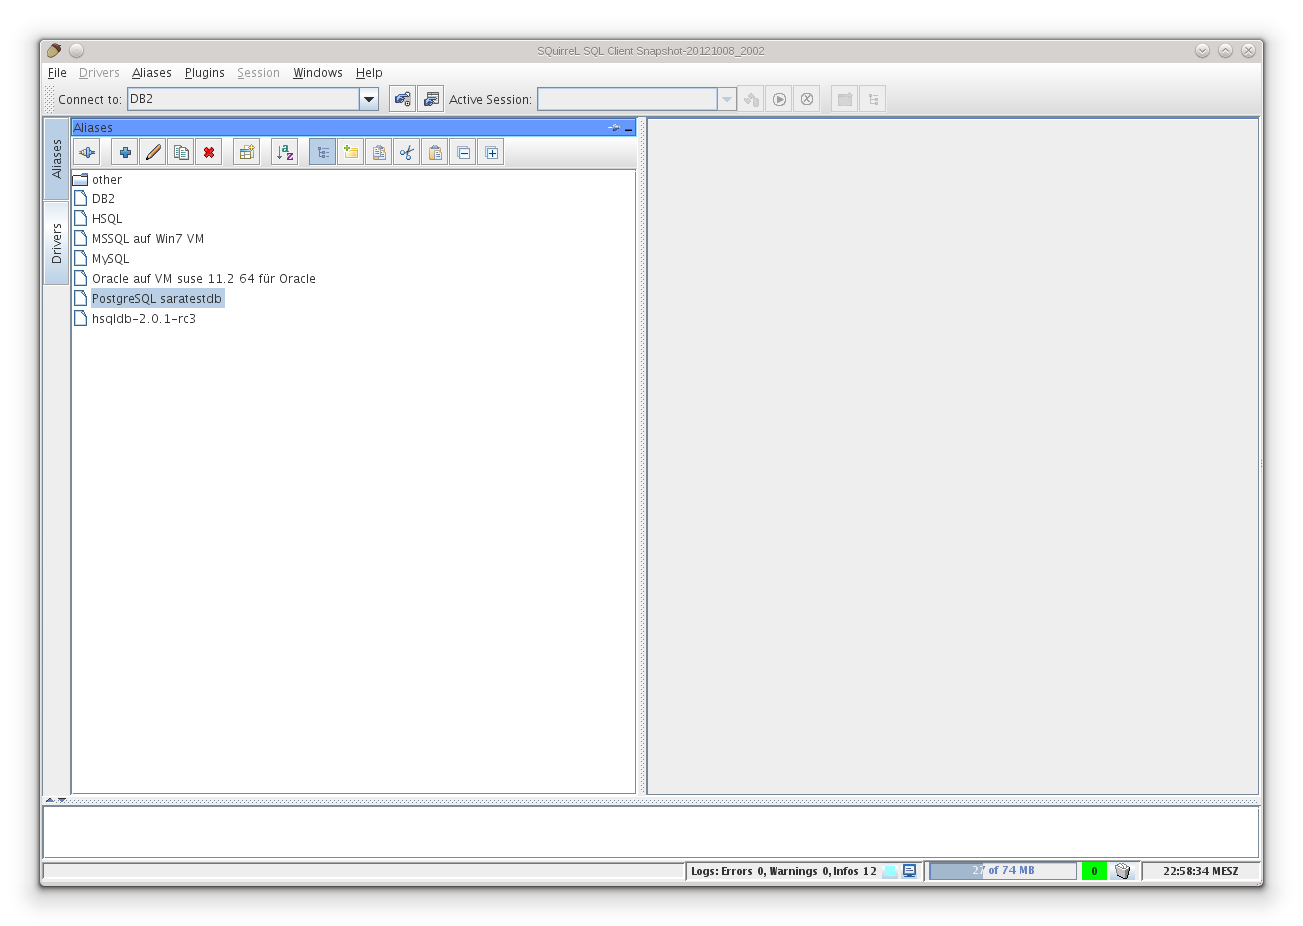
Introduction:
-
Configure or add a driver.
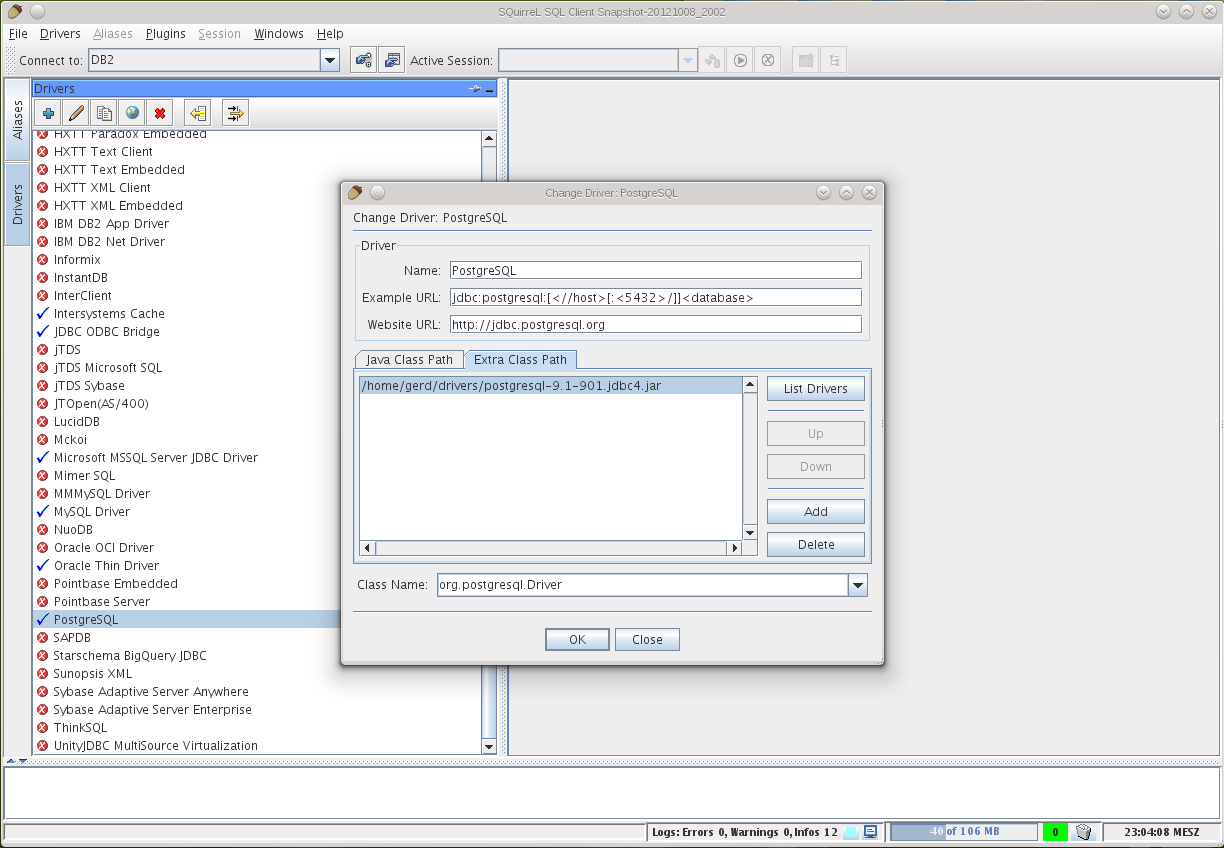
-
Create an Alias.
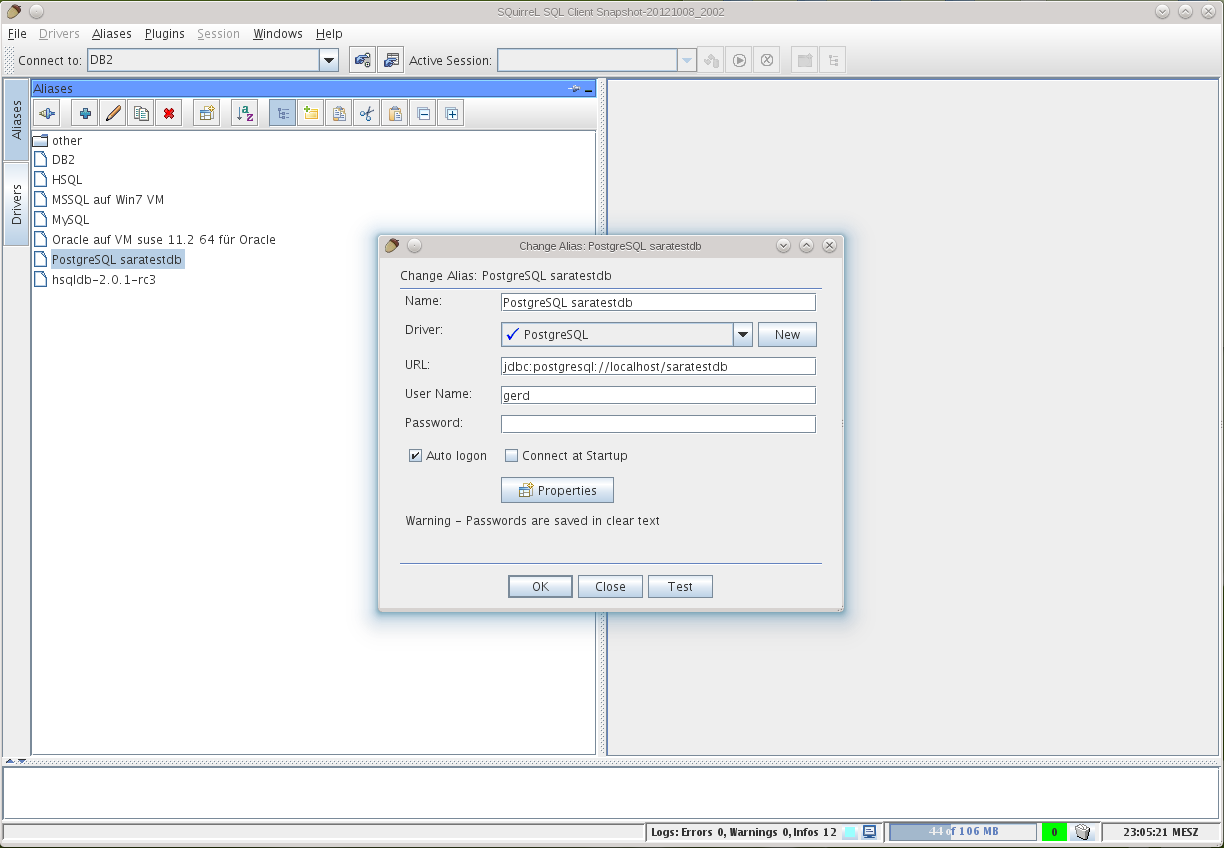
Features, Screen Shots
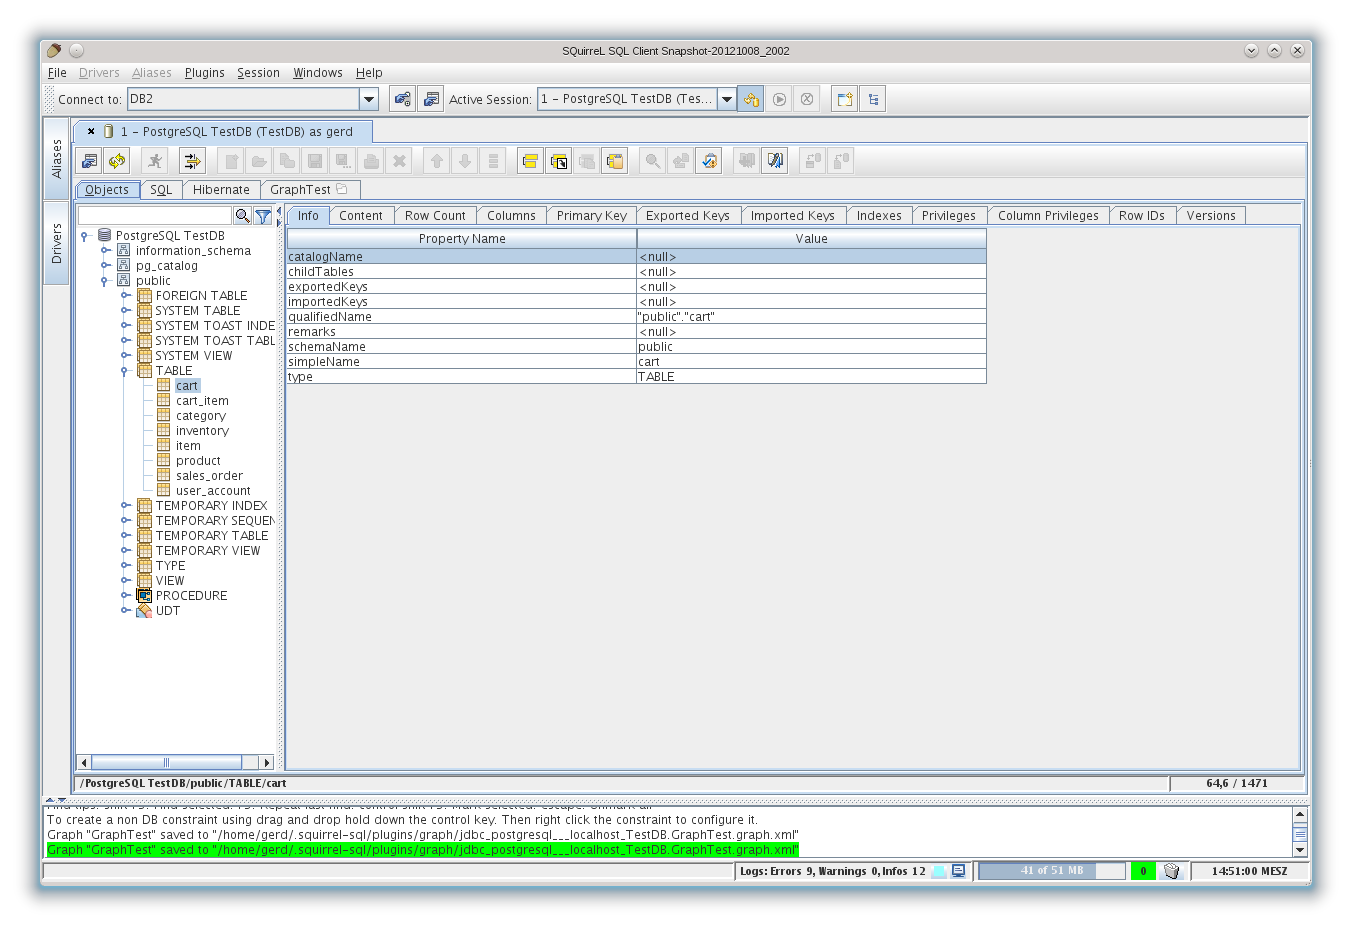
Object Tree of Session window
Right-click to access the popup
menu which provides access to advanced script generation and graphing features. The graph
plugin allows the user to create table charts.
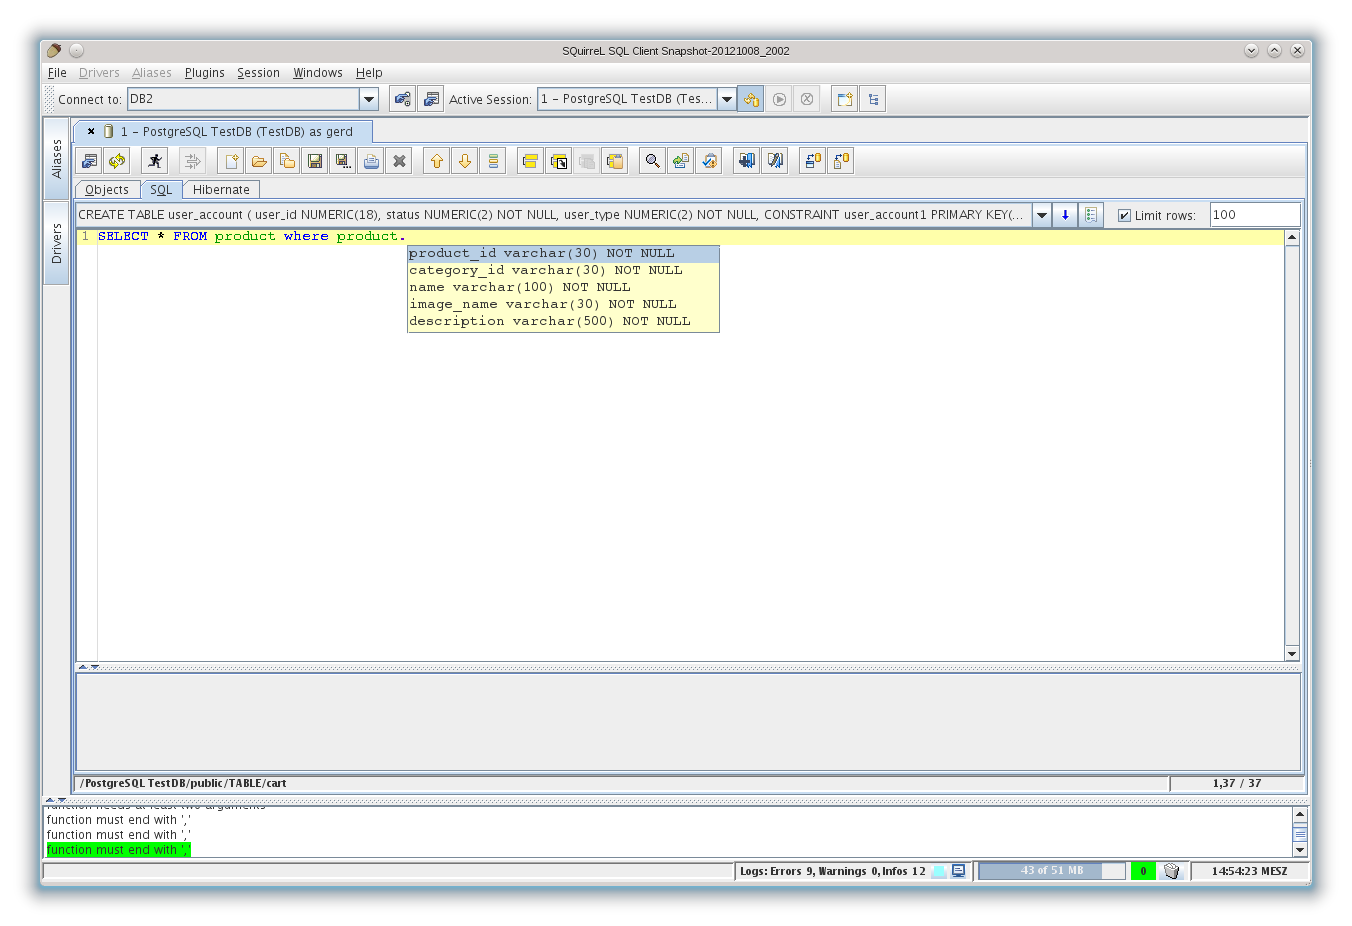
SQL Editor with code completion popup (ctrl+space) open
Code completion can be used to access drop-down lists of
options that include keywords, tables, columns, views, stored procedures.
Code completion also provides join generation functions. For example, look at the table
structure here. Hitting ctrl+space after the expression
#i,item,product,category,
(note the comma at the end)
SQuirreL will expand it to:
INNER JOIN product ON product.product_id = item.product_id

INNER JOIN category ON category.category_id = product.category_id
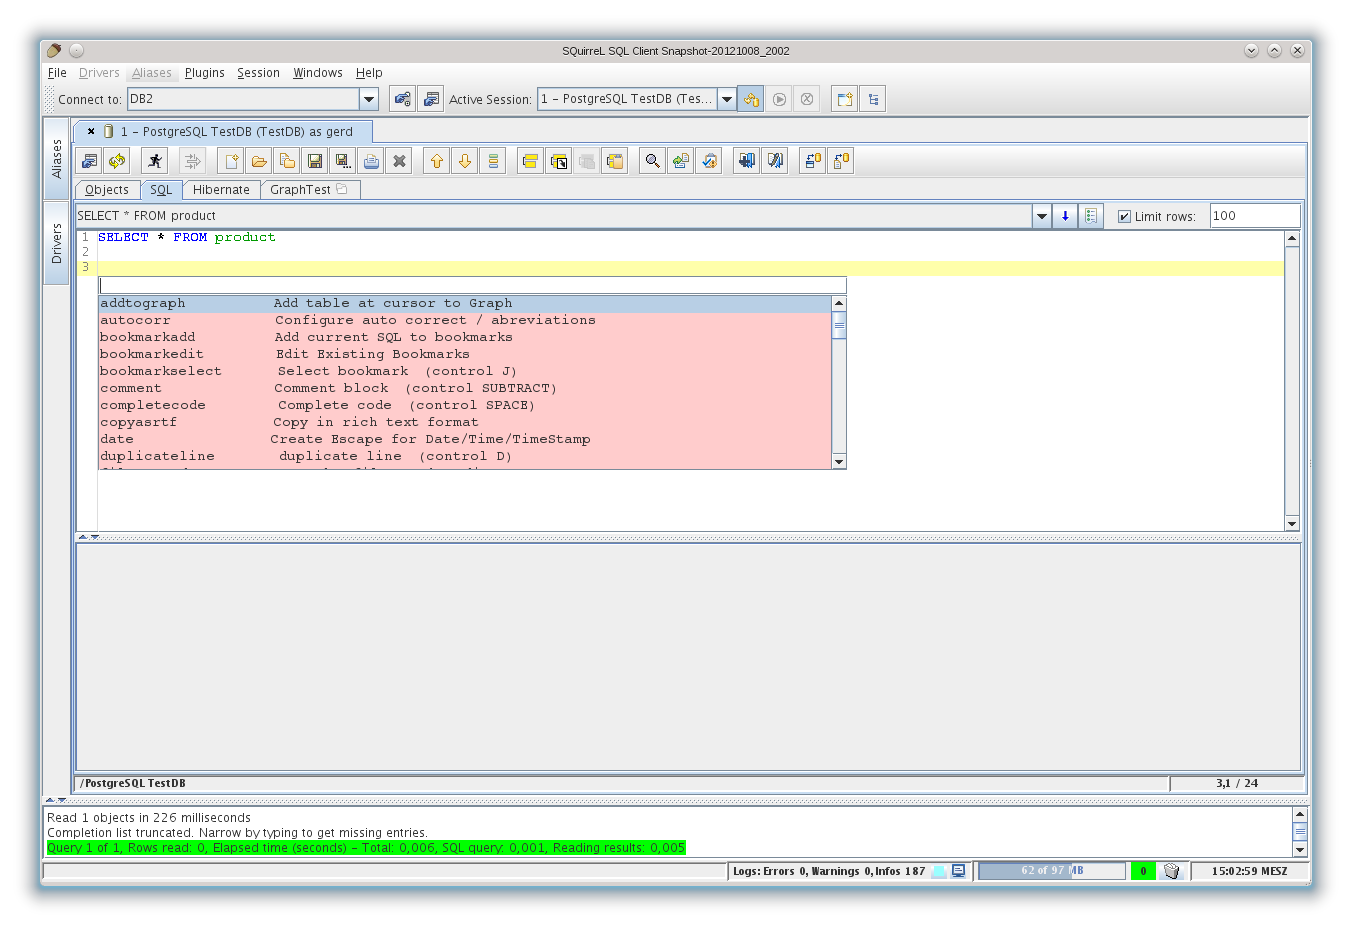
SQL Editor with tools popup menu (ctrl+t)
With the tools popup any editor function can be located with
only a single short cut: ctrl+t
Additionally, the list can
be searched incrementally with just a few keystrokes.
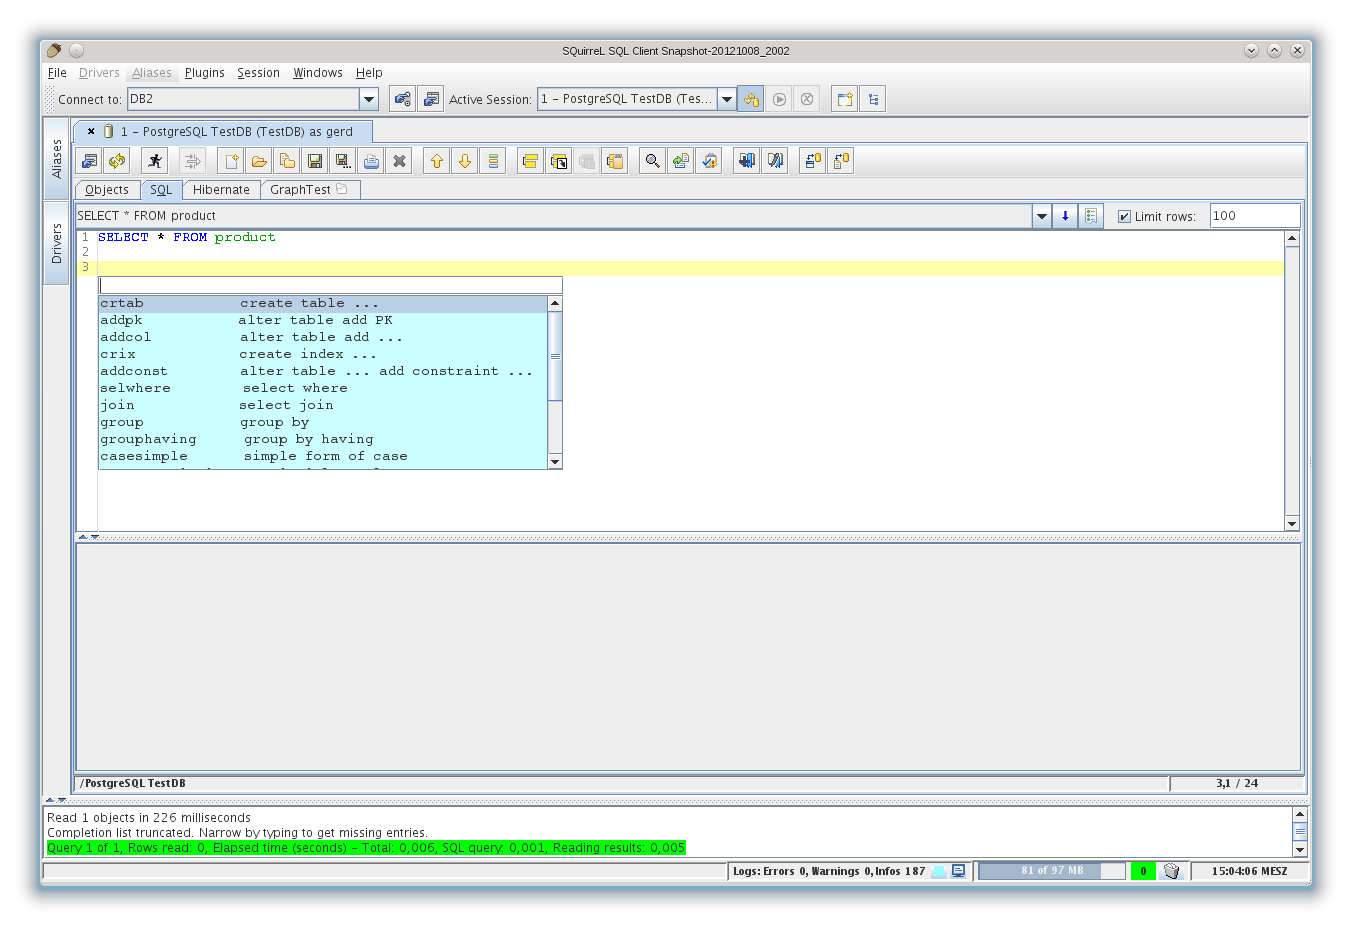
SQL Editor with bookmark selection popup (ctrl+j)
Bookmarks are user-defined code templates. SQuirreL
comes with several pre-defined example bookmarks for the most common SQL
and DDL statements.
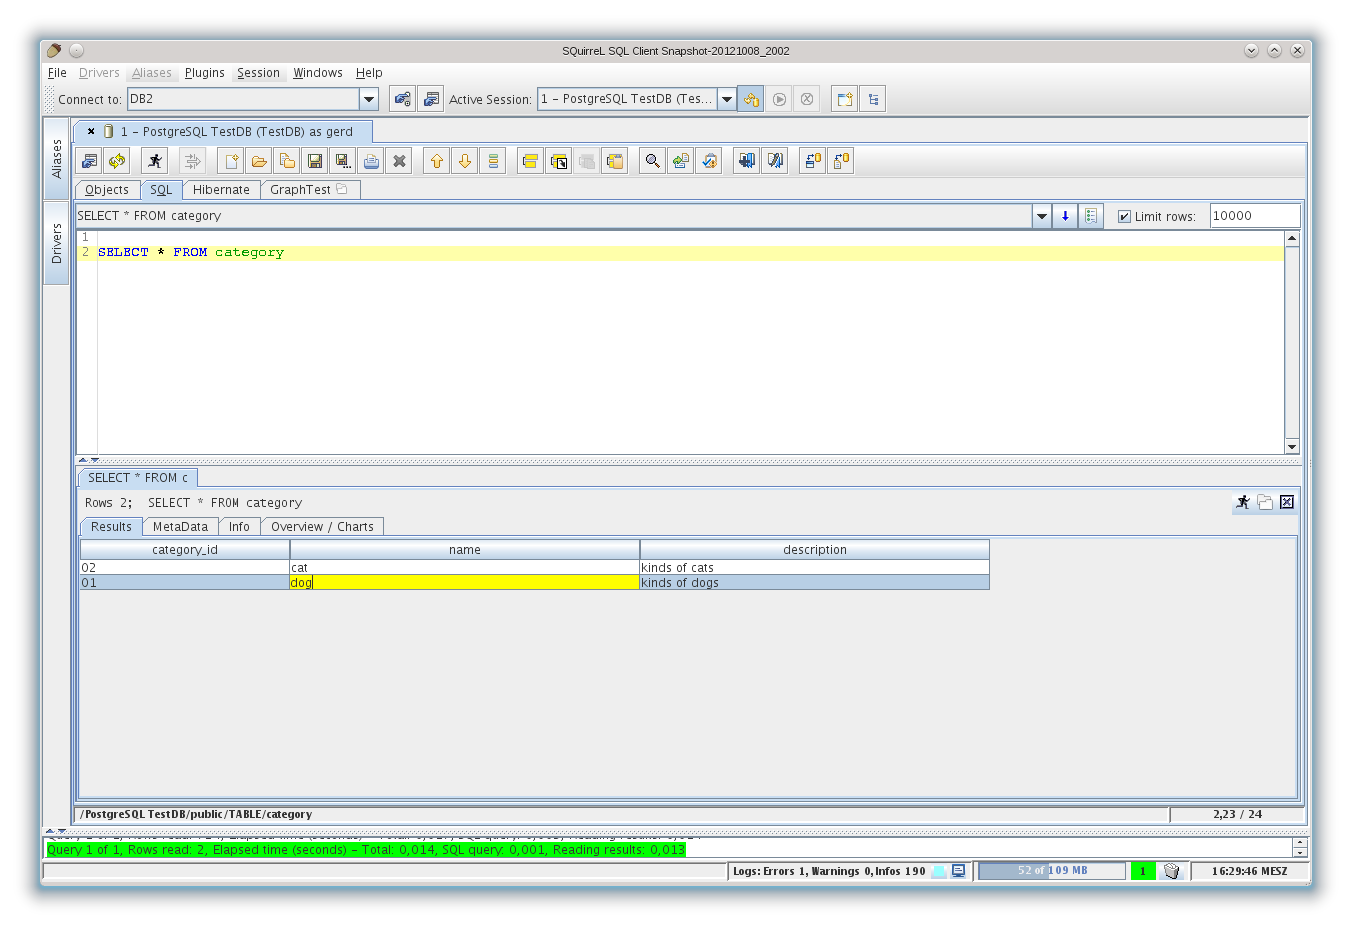
Editing of SQL results.
The result tabs of SQL
queries support editing the rows returned from a query on a single table. You
may also edit the contents tab of tables in the Object tree.
Graph: Charts of tables and their relations / Query builder.
To create new charts or to add tables to
existing charts right
mouse click on selected tables in the Object tree and choose the 'Add to graph' menu.
Graph manipulation functions can be accessed by using the right-click context popup menu or the arrow button on the lower left.
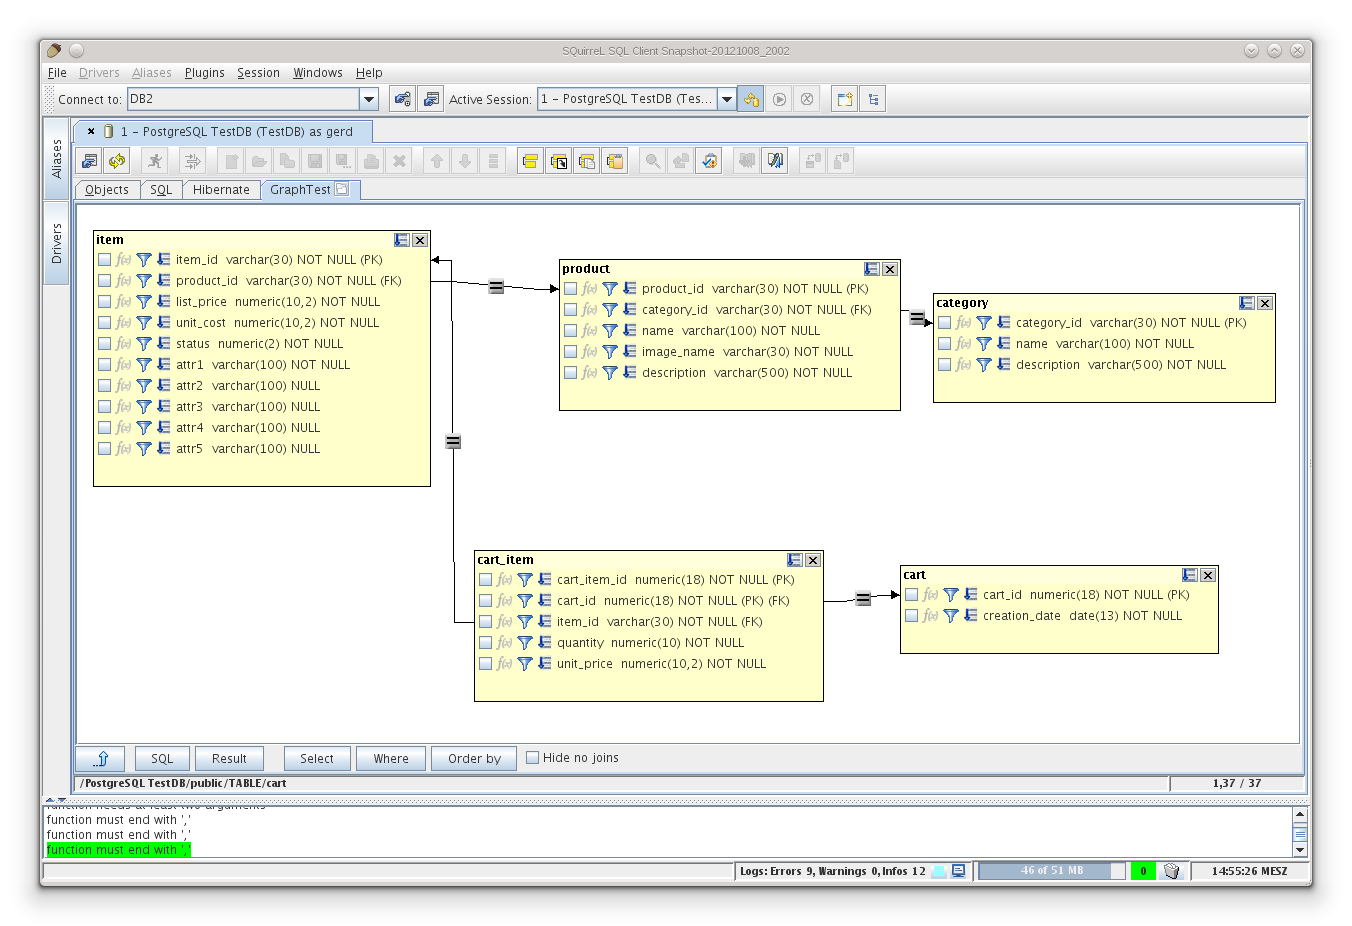
Functionality provided by the Graph plugin:
Query Building with instant SQL query generation and executing
Saving in Jpeg format
Printing
Linking / copying Graphs from other Sessions or directories
For a more detailed (though not up-to-date) description, see the paper by Gerd Wagner and Glenn Griffin:
English version
German version
Italian version, translation by Meo Bogliolo
|


